
Welcome
I love sharing my knowledge and passion for data and Tableau. Browse my blog, check out my portfolio, or search for something specific.
Latests Posts
-

Emerald City Insights
One of my favorite ways to get end users engaged with dashboards is by turning learning into a game. At work, I’ve built several interactive games in Tableau that boost engagement and help build dashboard and data literacy. My latest creation, Emerald City Insights, invites users to follow the Yellow Brick Road, meet the Scarecrow,
-
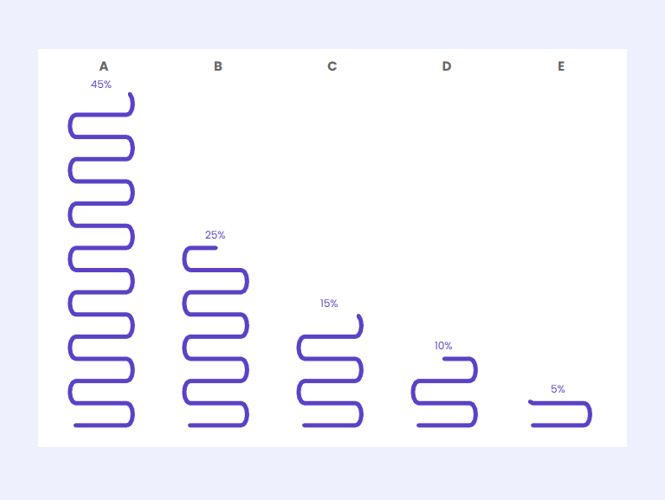
Tutorial + Template: Noodle Bar Chart
One of my favorite things to do with data is make it look like other things: chocolate, blood droplets, cigarette smoke, did I mention chocolate? So when I saw a Makeover Monday data set focusing on Asian cuisine in the U.S., my first thought was, “How can I turn this data into noodles?” Like most
-

TC25 Road Map of Resources
At Tableau Conference 2025 (TC25), I had the opportunity to present my 6-Step Road Map to Impactful Vizzes (based on this blog post). During my session, I walked through my process of going from a blank Tableau workbook to a completed viz (you can watch the session on Salesforce+) and check out my slides below:
